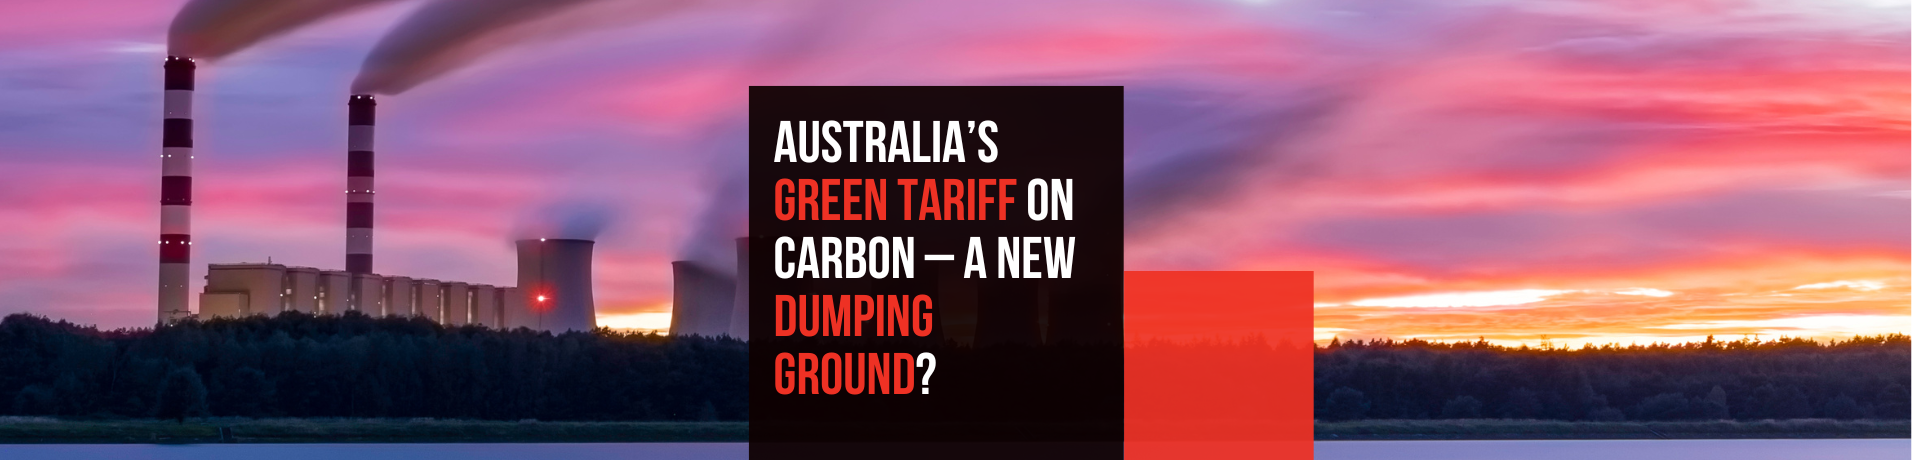
Over the next 12 months the Australian Government will consider introducing a carbon border adjustment mechanism (CBAM) – often labelled as a “green tariff” – with a formal review of options and feasibility due by October 2024.
What might be the impact of an Australian CBAM on trade? And what is to stop it from ending up as veiled trade protectionism? Will we need rules and procedures to regulate government action on carbon “dumping”?
In this paper, available in its entirety over the coming weeks, Moulis Legal’s International Trade team explores the potential effects of an Australian CBAM on key trading partners, its consistency with World Trade Organization norms, and the checks and balances required for such mechanism to operate fairly and achieve genuine climate goals, rather than as a shiny tool for protectionism in the new era of industrial policy.
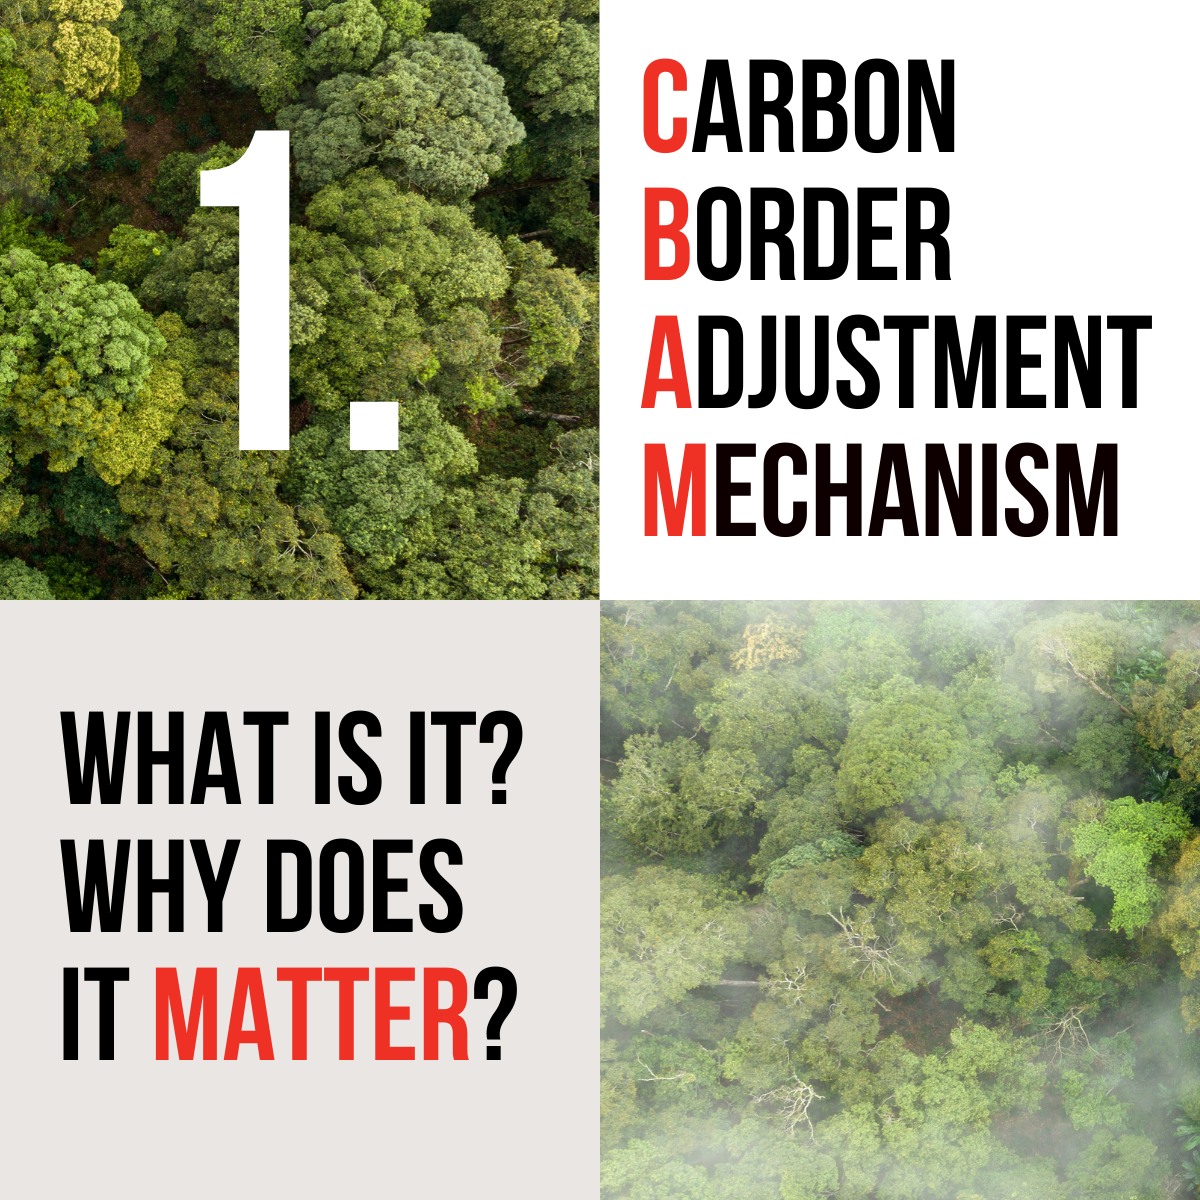
Why CBAM?
The oft-touted goal of a CBAM is to address “carbon leakage”. As governments across the world move towards meeting climate goals and costing carbon – for example through capping emissions and requiring the purchase and trading of carbon certificates to offset emissions over the cap – there are concerns that the manufacturing and supply chain will respond to the higher carbon cost imposed in one country by simply shifting operations to another country where the regulatory burden is lower. Carbon leakage can be visualized as a seesaw of greenhouse gas emissions: a decrease in emissions in one country with a rigorous climate policy might trigger a rise in another country with less strict rules.
If this happens, the policy goal of carbon reduction is defeated from a global perspective, while the higher cost jurisdiction also takes a double whammy of a declining, or exodus, of local industry.
Addressing such “leakage” at the border, by introducing regulatory and tariff schemes that ensure both domestic production and foreign production bear an equivalent carbon “cost” has gained traction.
The CBAM pioneered by the European Union provides a general model for such regulatory responses. As of 2026, the EU will charge importers a tariff on some products to make up the difference between the carbon price in their countries of origin and in the EU, with a transitional reporting phase starting 1 October 2023. The products affected are from six emissions-intensive sectors:
- iron and steel
- aluminium
- cement (including clinker and lime)
- electricity
- hydrogen
- fertilisers
Under the EU CBAM, the listed products entering the EU will bear a “carbon tax”, mirroring the carbon costs associated with the goods had they been produced in the EU. Importers would be required to purchase “certificates” representing the emissions contained within the imported goods. The price of the certificates will be calculated depending on the weekly average auction price of the EU emissions trading system (ETS) allowance, expressed in € / metric tonne of CO2 emitted (CO2e). In 2023, the price of carbon was around €94/mtCO2e (A$159/mtCO2e).[1]

How CBAM – or alternatives?
Other regulatory models may be considered by Australia, potentially drawing inspiration from other trade partners, such as the United Kingdom, United States or Canada. But the initiatives in those countries are also in infancy.
United Kingdom
The UK is itself undertaking consultations on a CBAM. In addition to a CBAM, the UK government is also considering Mandatory Product Standards (MPS). MPS would set a maximum limit for the greenhouse gas emissions generated during the production of a product. Any product exceeding this limit would be prohibited from entering the UK market.[2] This rule could apply to both domestic and imported products, with an emphasis on regulating high-carbon imports. The MPS could potentially be introduced in sectors such as steel, cement, concrete and chemicals, which account for 42% of the UK's industrial emissions. Voluntary product standards and product labeling are also being proposed.
Canada
Canada is working on a policy called Border Carbon Adjustments (BCA), similar to the EU's CBAM. Import charges would be applied to goods from countries that either do not have carbon pricing or apply a lower carbon price to ensure they face similar carbon costs to domestic producers. The government is also considering export rebates, so domestic products can compete on equal footing in foreign markets.[3]
United States
The US has been slower in addressing carbon leakage. Last year, Senator Sheldon Whitehouse introduced the Clean Competition Act. As there is no unified emission trade system or federal carbon price in the US, a more direct "carbon tariff" was proposed in this Act. The main difference between the US CCA and the EU CBAM is about the calculation of the carbon border price. EU’s emissions prices are calculated based on the weekly average of the ETS auctions; while CCA imposed a fixed rate, i.e. $55 per ton, and an increase by 5% above inflation every year on domestic and imported goods which exceeds the industry’s average carbon intensity. This baseline will decrease each year, compelling industries to reduce their carbon footprints.[4]
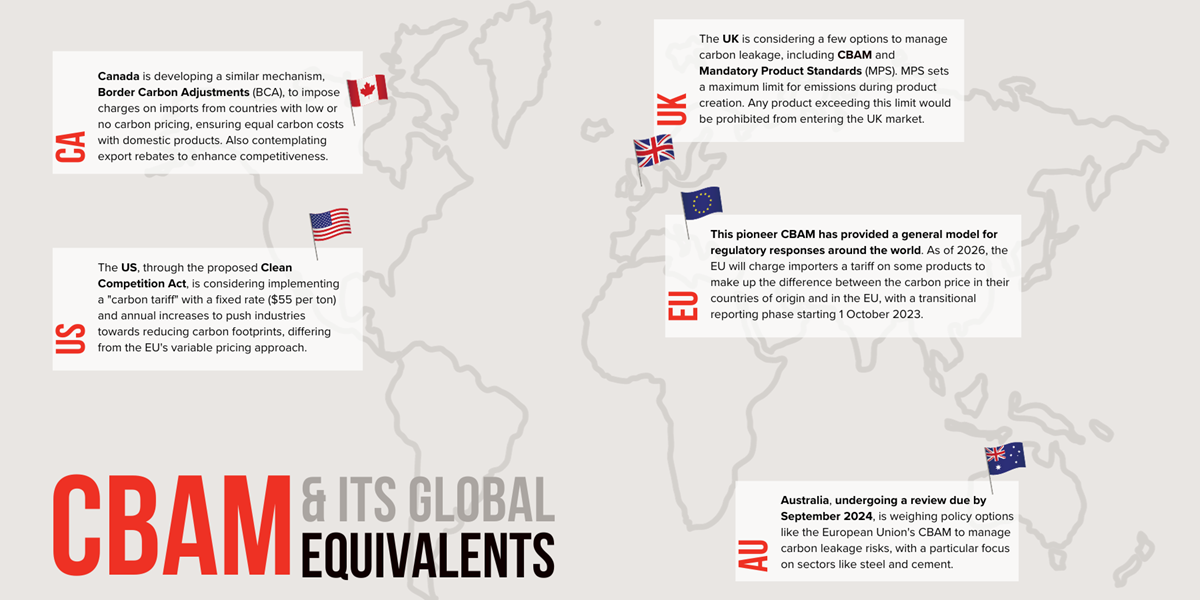

Australian Government response
As Australia’s climate regulations have become more stringent – particularly with the introduction of the climate safeguard mechanism, which includes a cap on emissions – carbon-intensive industries have expressed concerns regarding the potential for “carbon leakage”. This has prompted calls for an Australian version of a CBAM to stop Australia from becoming the “dumping ground” of low carbon cost imports.[5]
On 15 August 2023, Climate Change Minister Chris Bowen confirmed that Australia would formally consider new policy options, like the CBAM being implemented in the EU, to address the risk of carbon leakage, announcing a review to be completed by 30 September 2024.[6]
The review will ask for feedback from industry and community groups and international trade partners and cover risks tied to carbon leakage, potential policy options and an assessment of what materials may be subject to an Australian CBAM.
In the Terms of Reference, the Australian Government has indicated the review would identify key products and sectors affected by carbon leakage risk, with particular focus on, but not limited to, steel and cement sectors.[7] Chris Bowen in his speech also advised that the review would focus on “the feasibility of an Australian Carbon Border Adjustment Mechanism, particularly in relation to steel and cement.”[8] Interestingly, he mentioned aluminium twice and emphasized that: “Making Australia a renewable energy superpower and leader in areas such as critical minerals will require essential industrial inputs – like steel, cement and aluminium.”
On 6 September 2023, the government announced that ANU professor Frank Jotzo would provide advice during the review of potential policy options.[9]
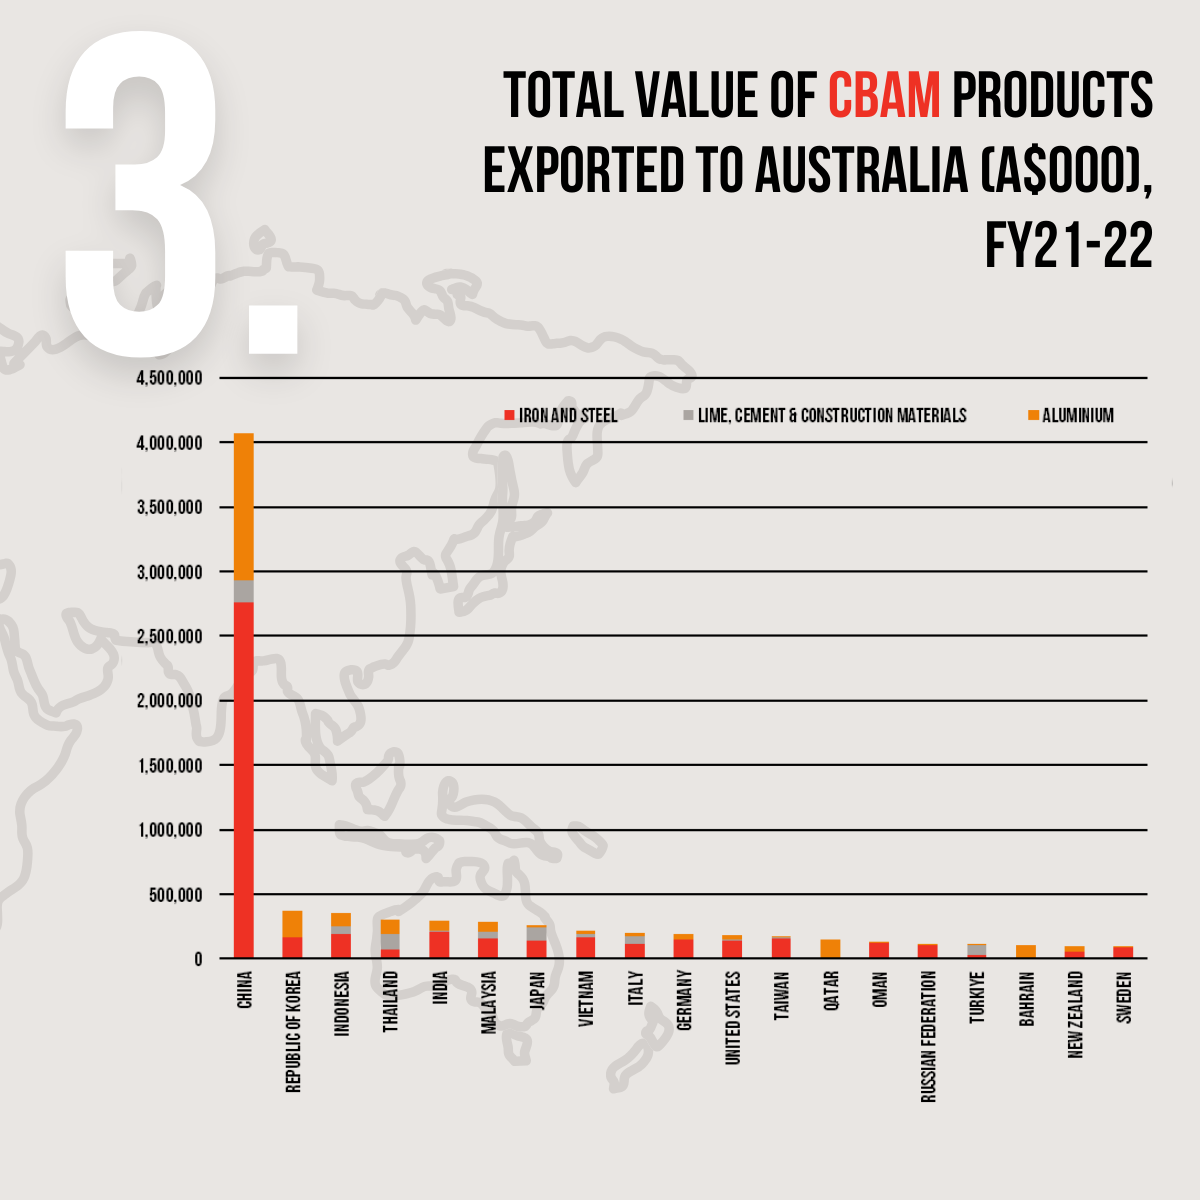
Who would an Australian CBAM hit hardest | Total value
The entry into operation of the EU and any prospective Australian CBAM may still be relatively distant. But the numbers suggest that the effects of a “green tariff” on trade and supply chains will be complex and profound.
If cement, iron and steel, and aluminium were targeted, one aspect seems fairly clear. As the top exporters of AU CBAM products to Australia in terms of value (Figure 1), China, South Korea and Indonesia would be most affected.
However, these countries may not be the most affected by an Australian CBAM when their relative dependence on exports to Australia is taken into consideration.
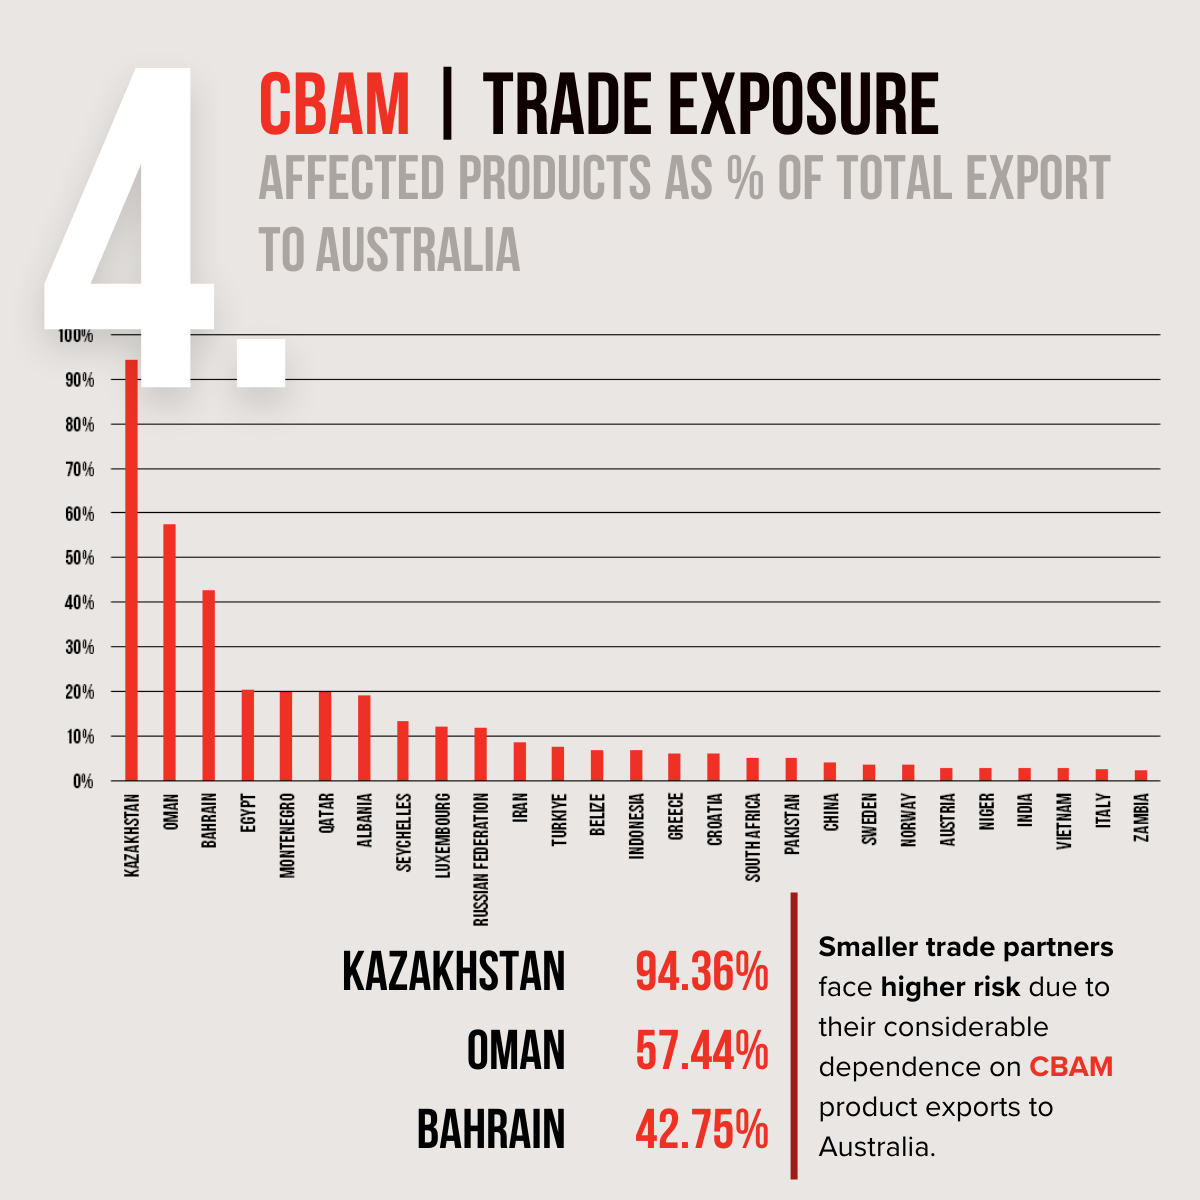
Who would an Australian CBAM hit hardest | trade exposure
In terms of the proportionate impact of an Australian CBAM, the statistics tell a less obvious story.
Although China, South Korea and Indonesia are top of the list in terms of value, smaller trade partners, like Kazakhstan, Oman, Bahrain, would be hardest hit by a carbon tariff in terms of trade exposure.
When we divided the value of CBAM products exported by the total value to Australia, these countries exhibited a substantial reliance on CBAM-related products, accounting for 94.36%, 57.44%, and 42.75% of their total exports to the nation, respectively.
This suggests that Australia’s smaller trade partners might face a higher risk of a negative impact, due to their considerable dependence on CBAM product exports to Australia.
However, the sectors under consideration by the report have complex interdependencies that may complicate any Australian CBAM. Let’s dive deeper into the specifics.
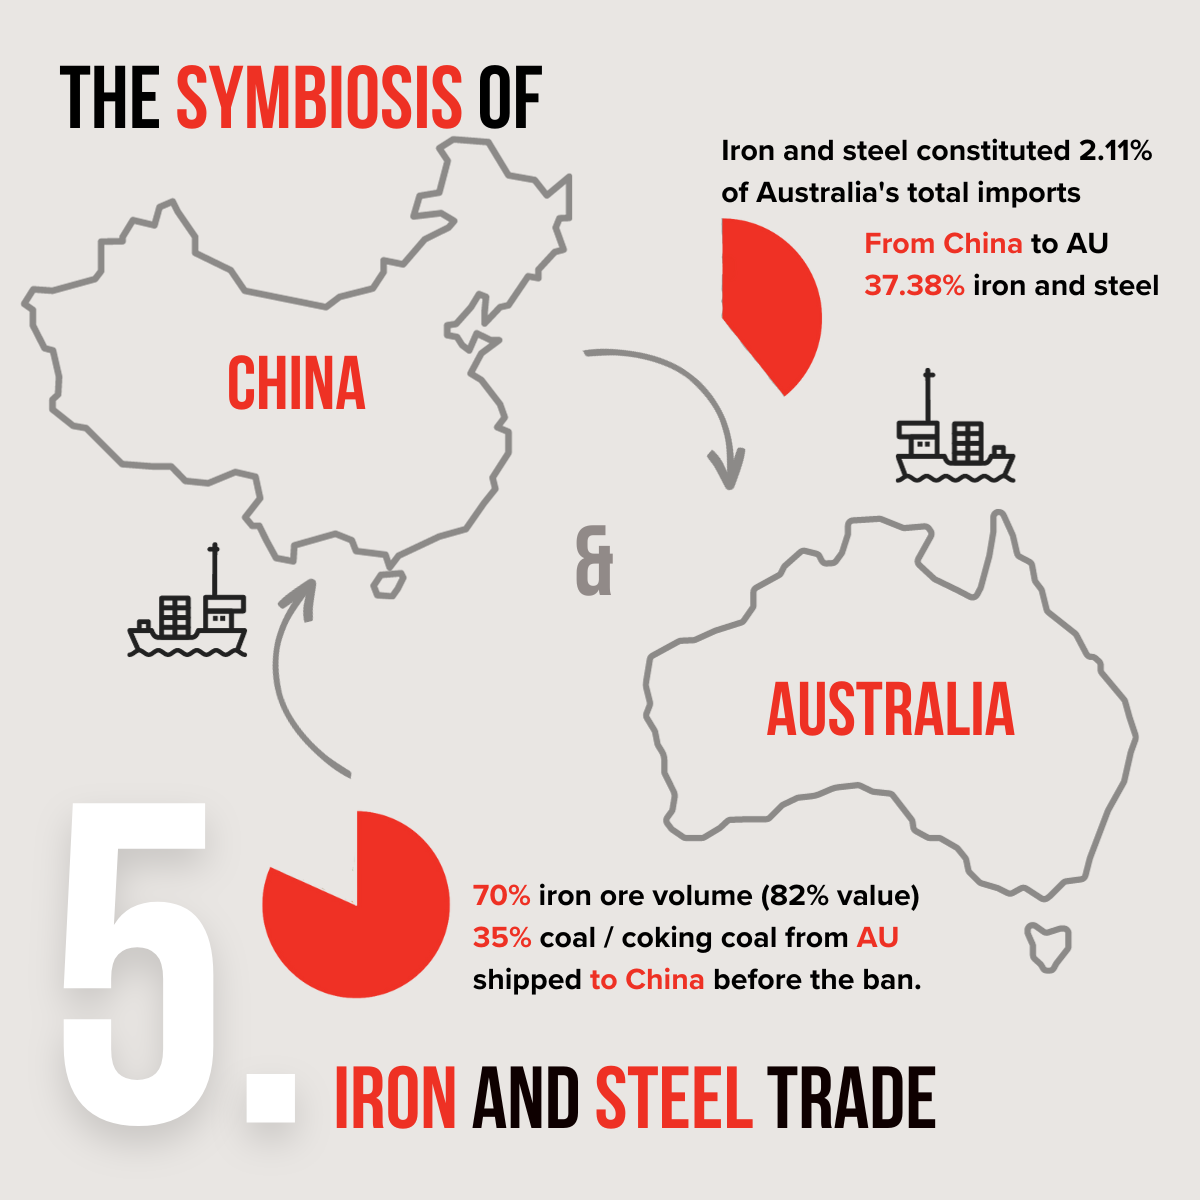
Impact of an Australian CBAM | the symbiosis of China and Australia’s iron and steel trade
Iron and steel imports constituted 2.11% of Australia's total imports in FY 2021-22, and a significant 37.38% of that was from China.
At the same time, Australia’s economy is intrinsically linked to China’s steel industry – by shipping over 70% of its iron ore output by volume (or up to 82% by value) and 35% of coal and coking coal export/output by volume to China (before the Chinese unofficial ban on coal from mid-2020 to the start of 2023).
Given the interrelated nature of trade in iron and steel, the Government will need to weigh the issue of “carbon leakage” against the flow-on effects of a steel import tariff for Australian iron exports and Australian consumers of steel imports.
Let's take a closer look at the numbers.
Iron and steel
Australia has an import-dominated iron and steel market. In FY 2021-2022, Australia exported iron and steel products worth A$1.1 billion but imported goods valued at A$7.4 billion. Iron and steel products imports constituted 2.11% of Australia's total imports in FY 2021-22, and a significant 37.38% of that was from China. Meanwhile, India was a distant second, supplying 2.78% of Australia's total iron and steel imports.
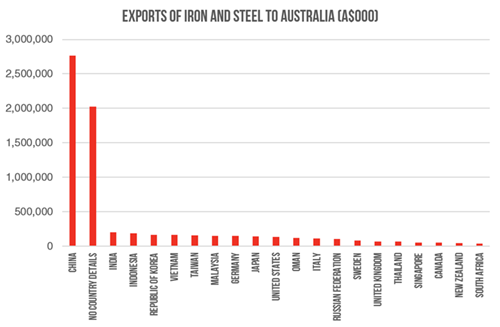
Figure 1: Total exports of iron and steel to Australia
At the same time, Australia is the world's largest producer and exporter of iron, according to the data from the World Steel Association.[10] It contributes 37% to global iron ore production and holds 52% of the global iron ore export volume.[11] In FY 2021-2022, Australia's iron ore and concentrate exports totaled A$132 billion, making up 25% of its overall exports. Also, iron ore was Australia's top export in this financial year.

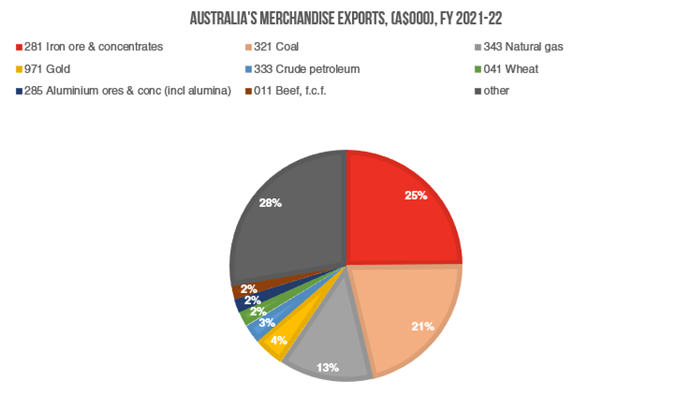 Figure 2: Australia’s merchandise exports
Australia’s economy is intrinsically linked to China’s steel industry – by shipping over 70% of its iron ore output by volume (or up to 82% by value) and 35% of coal and coking coal export/output by volume to China before the Chinese unofficial ban.
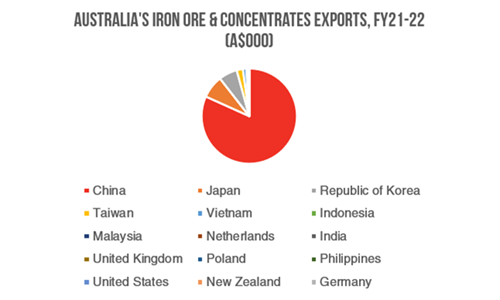
Figure 3: Australian iron ore and concentrates exports
Both Australia’s and China’s steel industries are currently carbon intensive, but Australia’s domestic steel production accounts for only 0.3% of global production. Given the interrelated nature of trade in iron ore and steel, the Government will need to weigh the issue of “carbon leakage” against the flow-on effects of a steel import tariff for Australian iron exports and Australian consumers of steel imports.
Aluminium trade - Australia's export | import paradox
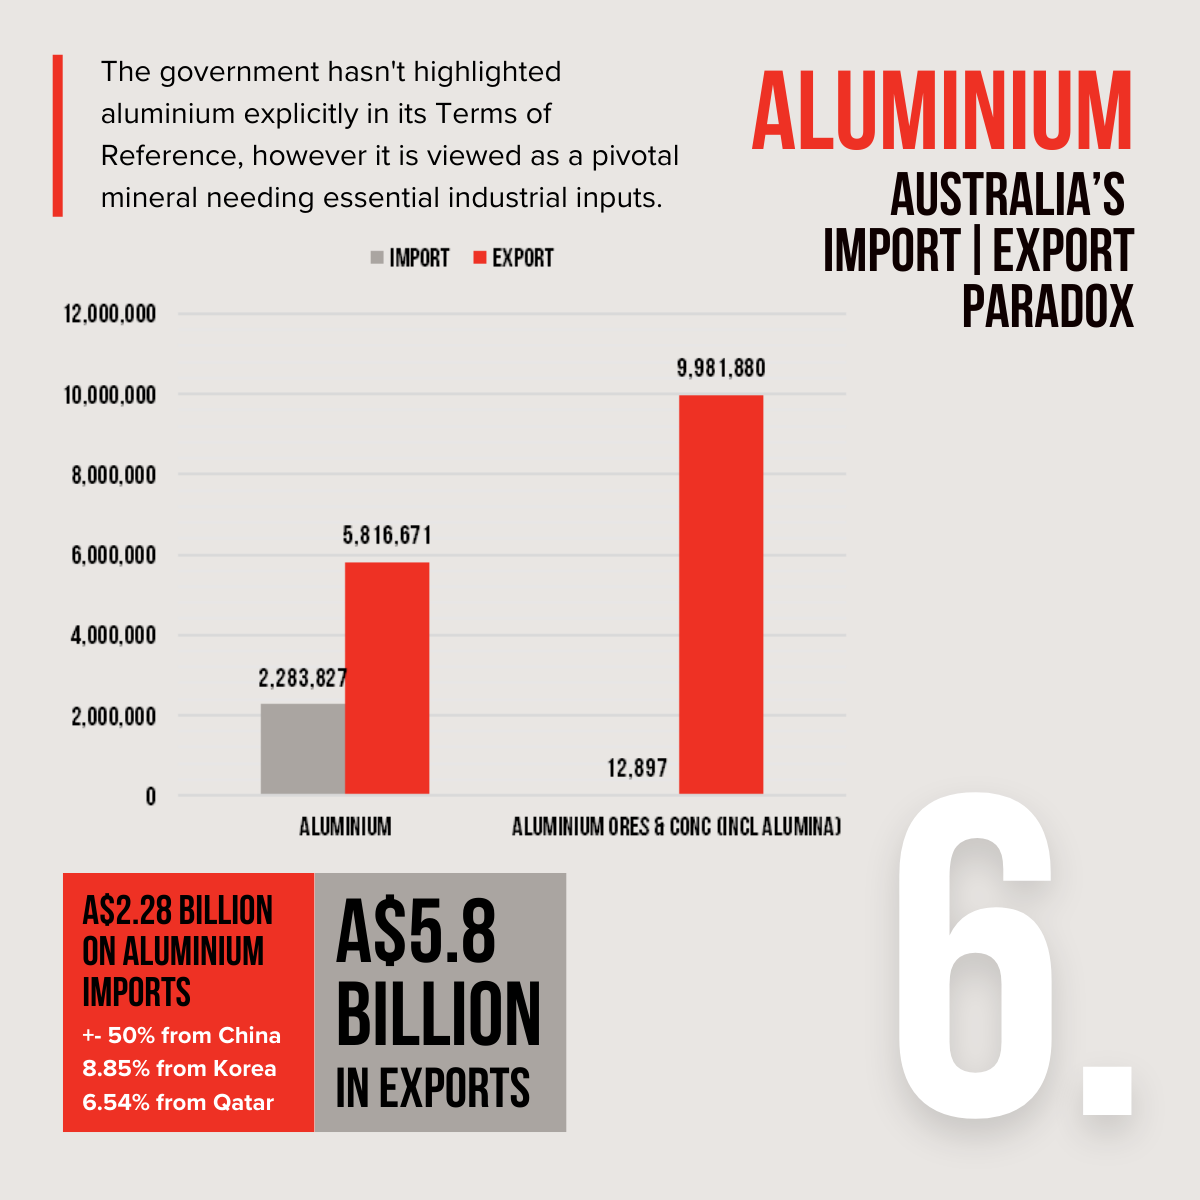
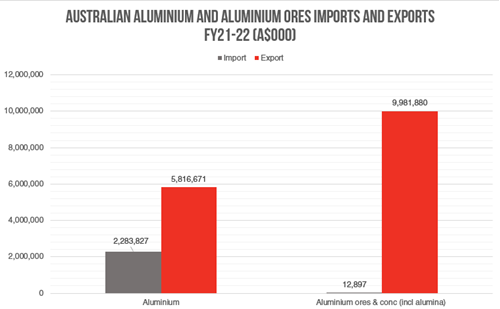
Aluminium is another carbon-intensive industry since the bauxite (the most common ore of aluminium) extraction and refineries require large quantities of electricity. China is the largest producer of primary aluminium, contributing to nearly 60% of the global production. In FY 2021-22, Australia imported A$2.28 billion of aluminium, with about 50% contributed by imports from China, 8.85% from Korea and 6.54% from Qatar.
However, the picture is more complicated than it may seem. Despite significant imports, Australia actually exports more aluminium than it imports, with an export value of 5.8 billion compared to 2.2 billion in imports during FY 2021-22. The carbon footprint of China’s aluminium production is compounded by the fact that almost all of Australia’s enormous bauxite production is exported to China (98.4%). The industry, highly dependent on coal-fired electricity in Australia, demands substantial energy inputs, with electricity costs constituting 30-40% of the smelters' operational costs.
The sectors under consideration in the report have complex interdependencies.
In the end, Australia may decide that it cannot easily accommodate a CBAM that affects those industries, and may look further afield, perhaps to carbon intensive rivals in agriculture sectors.
Domestic manufacturing - the true driver of cement?
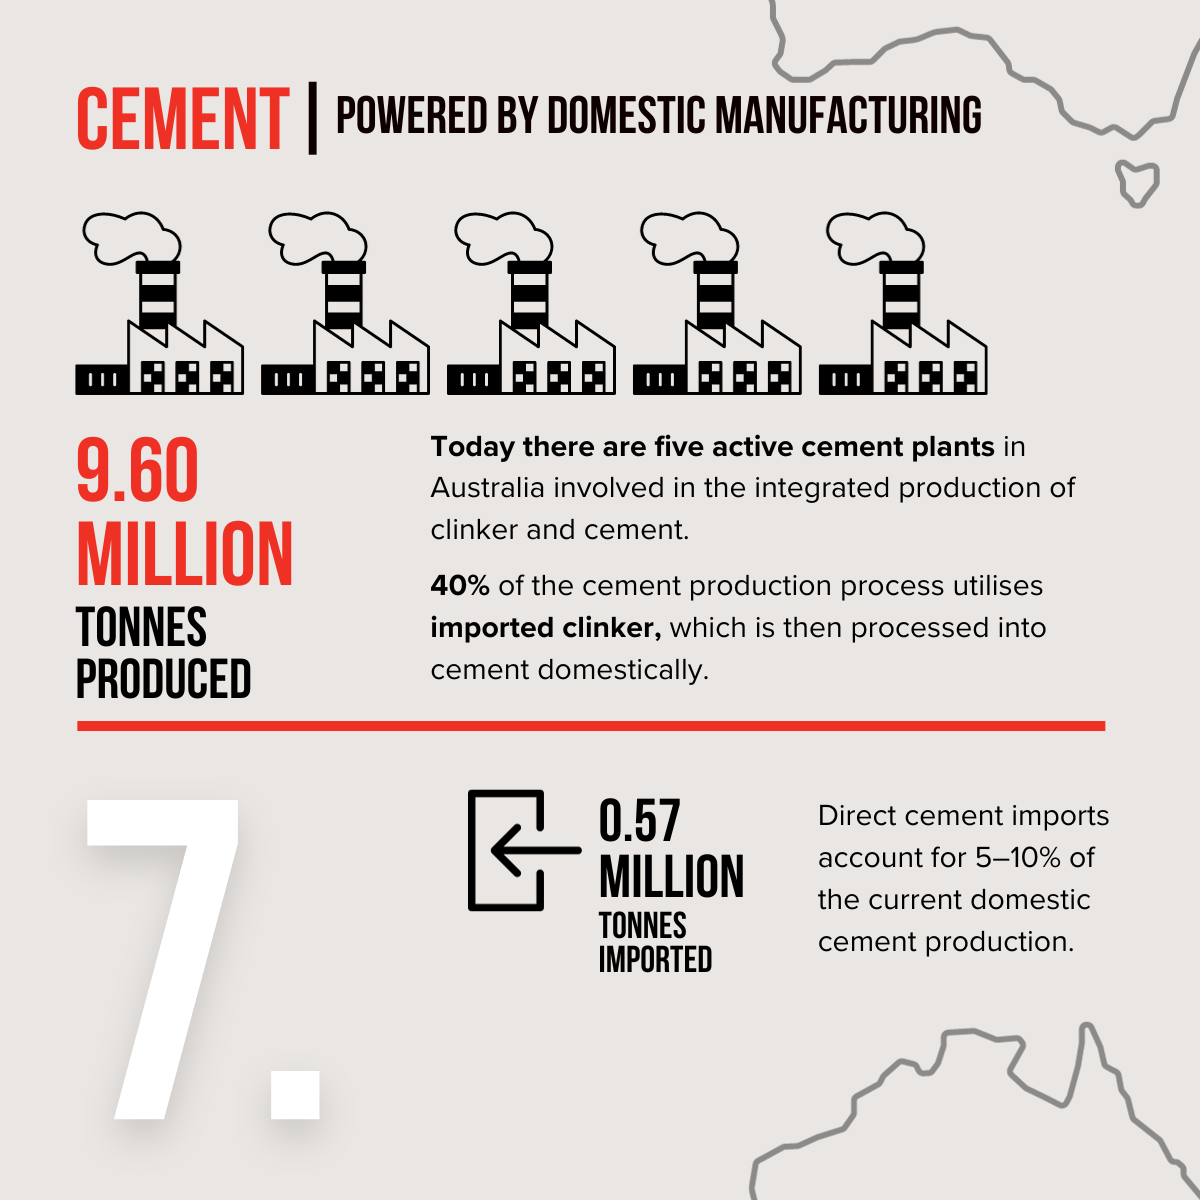
The next CBAM target in line is cement, including clinker and lime. The Australian cement industry is a notable supporter of CBAM. Leading manufacturers Adbri and Boral argue that CBAM would help to bolster local competitiveness and jobs.[12]
China, Thailand, and Japan are the top three countries exporting lime, cement and construction materials to Australia in terms of value.[13] However, the majority of cement imports, in terms of volume, appears to come from Thailand, Vietnam, and Indonesia.[14]
Data from the Cement Industry Federation showed domestic Australian cement production was 9.60 million tonnes in 2020-2021, contrasted by a relatively minor import volume of 0.57 million tonnes.[15] It seems that the industry is predominantly powered by domestic manufacturing.
However, there's more to the picture. Highlighting the intricate nature of trade, a report from USB indicated that dominant firms like Adbri and Boral import substantial volumes of cement-related products, 56% and 40% respectively, from Japan, Malaysia and other countries.[16] According to another report from an international research centre VDZ, of the cement produced in Australia, nearly 60% emerges from integrated manufacturing plants, whereas 40% is derived from imported clinker and processed at grinding facilities.[17] The Australian cement industry tends to have a higher carbon footprint compared to several international counterparts, including China.
How to keep international trade fair in the age of carbon pricing?
For businesses in supply chains that are exposed to border carbon measures, how to respond to these coming-of-age regulatory initiatives, and the associated cost in compliance or adaptation, will be a new challenge.
Determining the carbon footprint of products, including everything from raw materials extraction to shipping, will require highly technical calculations and data collection. A CBAM will have direct and indirect impacts along the length of the supply chain. Businesses will be forced to either absorb a CBAM cost at the expense of profits, pass it on to their suppliers and consumers, or substantially shift its business model or supply chain.
In August 2023, the price of carbon under the EU’s emissions trading scheme (ETS) was around €94/mtCO2e (AUD 159/mtCO2e). By contrast, the price of carbon under China’s emissions trading system was 66.49 CNY/RNB/mtCO2e (AUD14.24/mtCO2e).[18] For a Chinese steel exporter who has paid the carbon price in China, the additional carbon costs under an EU-style CBAM will have a material impact on the cost and price of imports.
This raises the question of whether CBAM’s primary concern is addressing carbon leakage or as a tool for achieving regulatory equivalence and cost/efficiency equivalence. Should the exporting countries be expected to develop a system mirroring the carbon costs, in order to exempt or "cushion” their exports from the effects of an importing country’s CBAM? Is a higher per unit carbon cost necessarily and realistically more effective or efficient in meeting climate goals? If carbon leakage is the policy target, should not consideration be also given to the amount of carbon emission associated with the products, rather than its carbon price tag? The issue is further complicated by the fact that there is not a unified global market or framework on emission trading – which means that there is no parameter on the “fair” price on carbon.
And as with other border adjustments for differences in pricing between imports and exports – namely, in the anti-dumping and countervailing context – affected exporters and importers can be expected to argue about whether the adjustment has been done fairly. If trade is to be kept fair, then, a domestic system for adjudicating those arguments needs to be incorporated into the mechanism. Multilateral rules to set a common standard would better level the playing field and help prevent protectionism from creeping into investigation and decision-making.
Even more simply, lower carbon pricing could be branded as a form of subsidisation, or even a kind of ‘carbon dumping’ that should be incorporated into duty calculations in existing anti-dumping and countervailing investigations. How current trade rules should police this also needs to be considered.
CBAM and WTO: climate concerns and trade norms
The EU notified its CBAM to the WTO on 5 September 2023, a possible admission that the measure does not conform to WTO obligations. Any Australian CBAM would likely also be reported to the WTO – and invite scrutiny in the WTO’s dispute settlement forum.
While both the Australian and EU governments carefully underlined their intent to adhere to international trade standards, the consistency of a CBAM with WTO norms remains a topic of debate. Some experts argue that the EU’s CBAM leans more towards protectionist penalties rather than a genuine climate measure, especially in light of the Paris Agreement's “common but differentiated responsibilities”.
CBAM could potentially breach the most favored-nation rule (MFN) articulated in GATT Article 1 if it distinguishes "like products" based on carbon content in a way that might negatively discriminate against products from other WTO Members. But the EU and Australia might contend that their CBAMs are permitted under exceptions, for example by arguing they safeguard exhaustible resources or preserve the life and/or health of humans, animals and plants.
While China hasn't explicitly shown an intention to lodge a formal WTO claim against the EU’s CBAM, it has questioned the policy’s implications in the WTO Committee on Trade and Environment. Other countries are adopting a firmer stance, even from within the EU. On 8 August, Poland asked the ECJ to annul the EU Regulation establishing the CBAM and challenged the ETS. With a heavy dependence on coal for its power generation, it concerns about its economy and energy security.
While the age of the CBAM has just begun, it is clear, then, that adjusting at the border for carbon “leakage” or carbon “dumping” will not happen quietly or without a fight.
For inquiries about the review’s procedures and for assistance with your submission do not hesitate to be in touch with partner Charles Zhan and special counsel Jessica Giovanelli of our international trade team here at Moulis Legal.
To receive legal insights like this or to download the full white paper at the conclusion of this series, register your interest by emailing legal.insights@moulislegal.com.
[1] World Bank Carbon Pricing Dashboard. See https://carbonpricingdashboard.worldbank.org/map_data.
[2] Addressing carbon leakage risk to support decarbonisation: Consultation. See https://assets.publishing.service.gov.uk/government/uploads/system/uploads/attachment_data/file/1149568/UPDATED_FINAL_CONDOC_-_HMG_TEMPLATE_-_ADDRESSING_CARBON_LEAKAGE_RISK_TO_SUPPORT_DECARBONISATION.pdf
[3] Exploring Border Carbon Adjustments for Canada. See https://www.canada.ca/en/department-finance/programs/consultations/2021/border-carbon-adjustments/exploring-border-carbon-adjustments-canada.html.
[4] https://www.whitehouse.senate.gov/news/release/whitehouse-and-colleagues-introduce-clean-competition-act-to-boost-domestic-manufacturers-and-tackle-climate-change.
[5] The Australian Workers Union backed the implementation of tariffs on Chinese steel and other imports. See https://www.afr.com/policy/energy-and-climate/carbon-tariffs-backed-by-union-to-protect-jobs-20230111-p5cbvw. Also, some experts argued that Australia should start work on CBAM as quickly as possible and provide investment certainty. See: https://carbon-pulse.com/197858/.
[6] Terms of Reference – Carbon Leakage Review. See https://www.dcceew.gov.au/sites/default/files/documents/review-carbon-leakage-terms-of-reference.pdf. Chris Bown’s speech to Australian Business Economists. See https://minister.dcceew.gov.au/bowen/speeches/speech-australian-business-economists.
[7] Ibid, also see media release https://minister.dcceew.gov.au/bowen/media-releases/safeguard-mechanism-one-step-closer-parliamentary-passage.
[8] Chris Bowen’s speech to Australian Business Economists. See https://minister.dcceew.gov.au/bowen/speeches/speech-australian-business-economists.
[9] Chris Bowen MP media release. See https://minister.dcceew.gov.au/bowen/media-releases/anu-professor-engaged-carbon-leakage-review.
[10] https://worldsteel.org/wp-content/uploads/World-Steel-in-Figures-2023-4.pdf.
[11] World Steel Association, World steel in figures 2023. See: https://worldsteel.org/steel-topics/statistics/world-steel-in-figures-2023/.
[12] Cement groups warn jobs at risk without local leg-up on carbon. See https://www.afr.com/companies/infrastructure/cement-groups-warn-jobs-at-risk-without-local-leg-up-on-carbon-20230403-p5cxky.
[13] Source: Department of Foreign Affairs and Trade – Trade statistical pivot tables, see https://www.dfat.gov.au/trade/trade-and-investment-data-information-and-publications/trade-statistics/trade-statistical-pivot-tables.
[14] https://www.indexbox.io/store/australia-cement-market-analysis-forecast-size-trends-and-insights/
[15] Australian Clinker and Cement Production. See: https://cement.org.au/australias-cement-industry/about-cement/australias-cement-industry/.
[16] ‘Perverse outcomes’ of carbon border tax revealed. See https://www.afr.com/policy/energy-and-climate/perverse-outcomes-of-carbon-border-tax-revealed-20230905-p5e28u.
[17] https://www.climatechangeauthority.gov.au/sites/default/files/058%20-%20Cement%20Industry%20Federation%20Submission.pdf
[18] Sources: World Bank Carbon Pricing Dashboard (https://carbonpricingdashboard.worldbank.org/map_data), Shanghai Environment and Energy Exchange (https://mp.weixin.qq.com/s/0G88zeKkgwtW77Hz6ZKPxg), and Ember Climate (https://ember-climate.org/data/data-tools/carbon-price-viewer/).
-